Which Alabama school districts earn an A on state report cards? Look here.
Alabama’s school district grades shifted toward each end of the grading spectrum compared to last year’s grades, with more districts rated as A’s, but also more rated as D’s and F’s.
The number of ‘A’ districts rose from 24 last year to 28. See the full list of Alabama school district rankings at the end of the article.
Statewide, 139 traditional and 10 charter school districts were given grades. And 1,346 individual public schools received grades, too. While traditional public school districts contain between two and 83 schools, most charter school districts contain only one school.
The statewide overall grade dropped one point to 83, a ‘B’. The way scores are calculated for state and federal purposes differs slightly, but the federal score remained the same as in 2022: an 83.
The grade letter reflects the overall score for a school, which is a combination of measures of achievement, graduation rates, readiness for life after high school and chronic absenteeism.
The chart below shows the distribution of grades among Alabama’s school districts each year grades have been given, beginning in 2017. No grades were given in 2020 or 2021 due to the COVID pandemic. Click here if you are unable to see the chart.
School districts improved on most of the report card measures, but many backslid on their high school graduation rates.
The graduation rate used in the calculation is from the class of 2022, and 7 out of 10 districts had a lower graduation rate than they had the previous year. The biggest drop in graduation rates among all districts was in Sumter County, where the rate dropped by 20 percentage points, from 93% for the class of 2021 to 73% for the class of 2022.
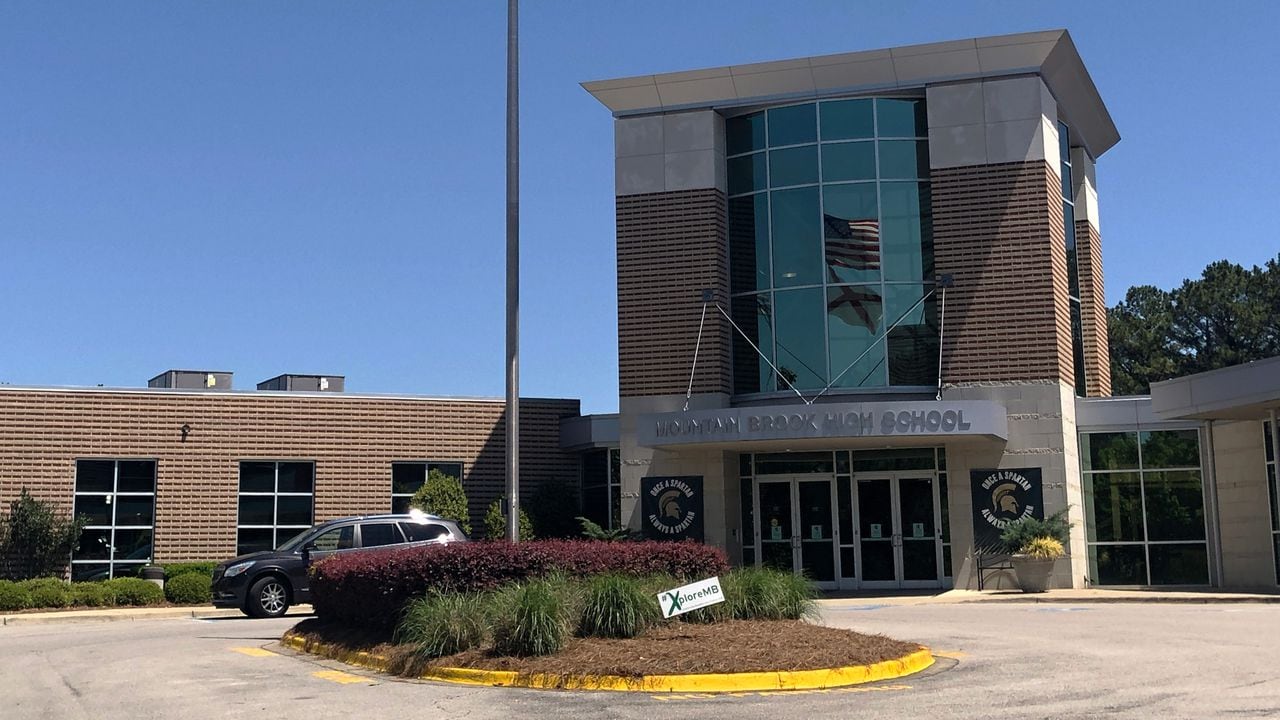
Statewide, graduation rates in traditional school districts ranged from 61% in Barbour County to 98% in Mountain Brook City schools. Charter school graduation rates ranged from 52% in the Mobile Area Education Foundation charter schools – which focuses on students who have already dropped out of school or are at risk of dropping out – to 100% at the Magic City Acceptance Academy.
Those graduation rate drops were costly, as 30% of the overall grade comes from the graduation rate.
The overall points earned in traditional public schools ranged from 60 in both Tarrant City and Barbour County schools and 98 in Mountain Brook City schools. Among charter school districts, total points earned ranged from 50 in the Legacy Prep charter school district to 83 in the University Charter School district.
While the state report card contains only the numerical measures for graduation rate, college and career readiness, chronic absenteeism, proficiency in English and math and progress for English learners, the federal report card contains information on the student population and the credentials and experience of teachers.
Complete state and federal report cards can be found at this link.
In the most improved category, two districts increased their overall score by 11 points: LEAD Academy charter school district raised their score from 53 to 64 points, and Linden City schools raised their score from 68 to 79.
The biggest drop in overall score was at Legacy Prep charter school district, which dropped from 66 to 50 points. Among traditional school districts, Sumter County dropped eight points, from 70 to 62 points.
The table below shows scores for both traditional and charter school districts. The measures shown are:
- “Grad rate” – the graduation rate for the class of 2022,
- “CCR rate” – the college and career readiness rate for the class of 2022,
- “ELA, math and science” – the proficiency rates for English language arts, math and science on spring 2023 testing.
Click the top of the column to sort in ascending or descending order.