Statistically speaking: Auburn’s defense folding in the red zone
Auburn’s mantra on defense this season has been to try to “defend every blade of grass” on the field, but those blades of grass between the goal line and the 20-yard line have proven particularly tricky for the Tigers’ defense at the season’s midway point.
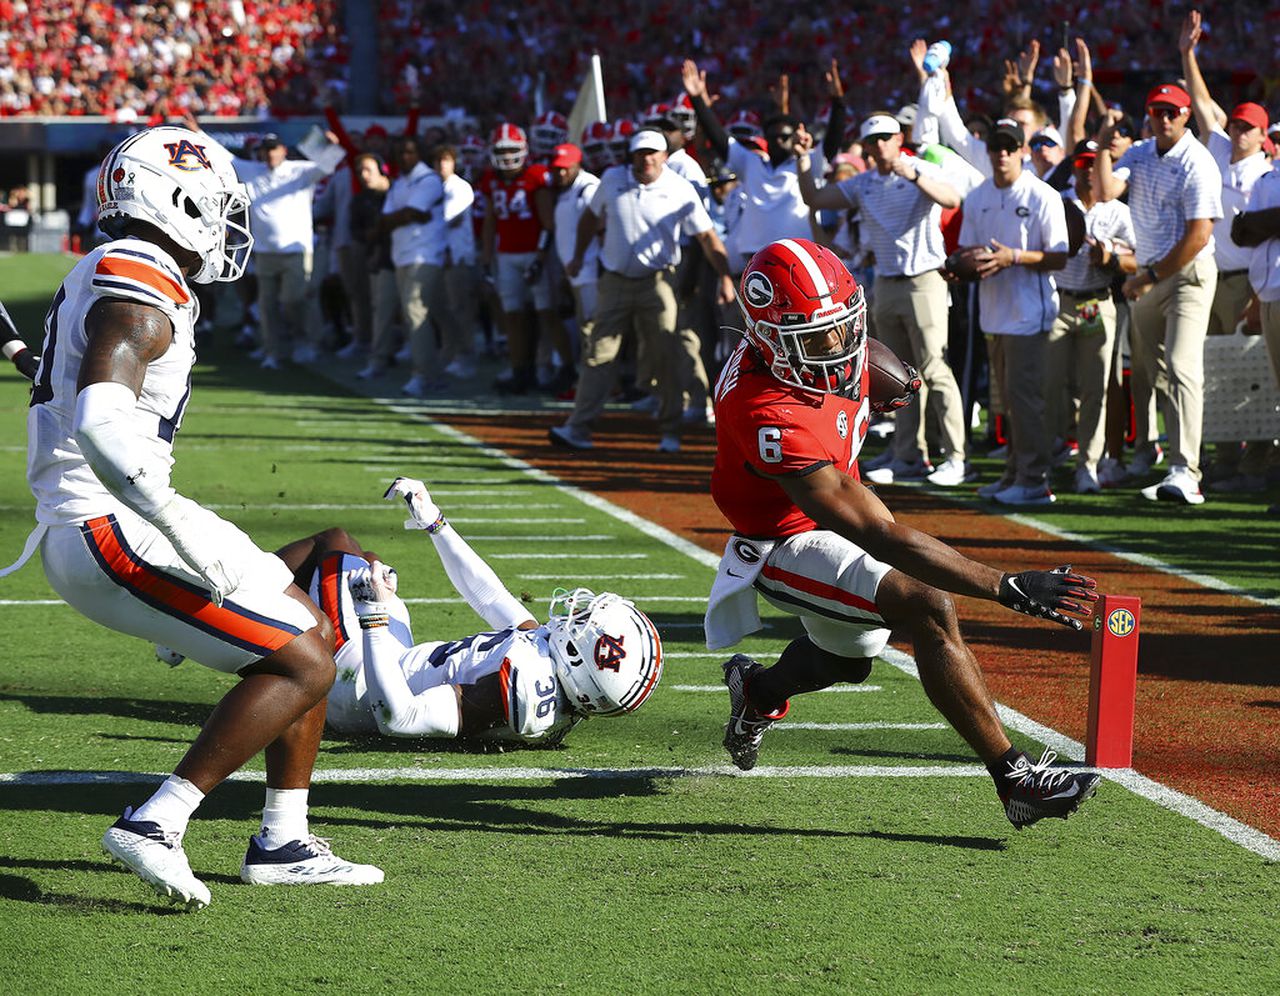
As Auburn enters the second half of its 2022 slate, it does so with a defense that has struggled in the red zone. The Tigers are 12th in the SEC and 96th nationally in red-zone defense, as opponents have scored on 87.5 percent of their trips inside Auburn’s 20-yard line. Auburn’s defense has also given up touchdowns on two-thirds of its opponents’ 24 red-zone trips this season after Georgia was exceptionally efficient in that area during its 42-10 win Saturday in Athens, Ga. The Bulldogs scored touchdowns on each of their five red-zone trips against the Tigers, with touchdown runs of 1, 1, 2, 7 and 15 yards in their latest win in The Deep South’s Oldest Rivalry.
Read more Auburn football: Bryan Harsin left searching for answers, “hope” after blowout loss to Georgia
Bryan Harsin justifies failed fake punt attempt against Georgia
Scarbinsky: Auburn will be hopeless and helpless until it is Harsin-less
Of the 16 red-zone touchdowns Auburn has surrendered this season, 14 of them have been on the ground. Auburn’s last four opponents — Penn State, Missouri, LSU and Georgia — have scored on 14 of their 16 red-zone opportunities, with 13 touchdowns, all of them rushing.
Auburn’s overall red-zone defense is on pace to be the program’s worst since 2011, when teams scored on 88 percent of their red-zone opportunities against the then-defending national champions. Auburn’s red-zone touchdown defense is on par with that of the 2020 team, which allowed touchdowns on 65.79 percent of opponents’ trips inside the 20-yard line (25-of-38). Of course, red-zone numbers can shift consierably from week-to-week; it takes just one really good bend-don’t-break performance to change the outlook of a team’s red-zone defensive efficiency, so Auburn could very well manage to correct course in that aspect of the field.
Still, Auburn’s defensive struggles with its back to the goal line are notable. The Tigers are tied for 91st among FBS teams in opponents’ red-zone touchdown rates, and only five Power 5 programs have allowed more red-zone touchdowns this season than Auburn’s 16: Oklahoma (17), Oregon (18), Arizona (19), Colorado (20) and Arizona State (20). Of those teams, only Oregon (5-1) has a winning record through six weeks.
Here’s a look at those numbers, as well as where Auburn ranks among SEC and FBS teams in various other statistical categories through six weeks:
—-
RUSHING OFFENSE (SEC rank, FBS rank)
2013: 328.3 (1st, 1st)
2014: 255.5 (2nd, 13th)
2015: 196.4 (5th, 35th)
2016: 271.3 (1st, 6th)
2017: 218.3 (4th, 26th)
2018: 167.5 (10th, 68th)
2019: 199.1 (4th, 33rd)
2020: 162.5 (7th, 67th)
2021: 161.5 (9th, 66th)
After Mercer: 285.0 (3rd, 14th)
After San Jose State: 247.5 (3rd, 14th)
After Penn State: 204.7 (6th 40th)
After Missouri: 174.0 (10th, 57th)
After LSU: 159.4 (10th, 66th)
After Georgia: 148.3 (10th, 75th)
Why: Auburn ran for 93 yards against Georgia.
.
PASSING OFFENSE
2013: 173.0 (11th, 106th)
2014: 229.5 (7th, 66th)
2015: 173.6 (12th, 110th)
2016: 169.5 (14th, 112th)
2017: 233.4 (5th, 65th)
2018: 222.5 (9th, 74th)
2019: 207.5 (9th, 87th)
2020: 220.3 (10th, 71st)
2021: 240.0 (8th, 59th)
After Mercer: 212.0 (11th, 84th)
After San Jose State: 190.0 (12th, 103rd)
After Penn State: 225.3 (9th, 87th)
After Missouri: 202.8 (12th, 103rd)
After LSU: 229.6 (9th, 82nd)
After Georgia: 218.8 (11th, 97th)
Why: Auburn threw for 165 yards against Georgia.
.
PASS EFFICIENCY OFFENSE
2013: 149.63 (6th, 24th)
2014: 156.79 (1st, 8th)
2015: 124.47 (10th, 79th)
2016: 135.17 (6th, 54th)
2017: 153.59 (5th, 13th)
2018: 140.11 (8th, 51st)
2019: 128.35 (9th, 89th)
2020: 122.96 (11th, 89th)
2021: 126.85 (12th, 94th)
After Mercer: 143.37 (9th, 61st)
After San Jose State: 123.23 (12th, 94th)
After Penn State: 121.20 (12th, 104th)
After Missouri: 121.09 (13th, 105th)
After LSU: 122.98 (13th, 101st)
After Georgia: 113.77 (14th, 114th)
Why: Robby Ashford completed 13-of-38 passes for 165 yards and a touchdown against Georgia.
.
TOTAL OFFENSE
2013: 501.3 (2nd, 11th)
2014: 485.0 (2nd, 16th)
2015: 370.0 (10th, 94th)
2016: 440.8 (6th, 43rd)
2017: 451.6 (3rd, 26th)
2018: 389.9 (11th, 78th)
2019: 406.5 (6th, 64th)
2020: 382.8 (9th, 77th)
2021: 401.5 (10th, 67th)
After Mercer: 497.0 (7th, 49th)
After San Jose State: 437.5 (9th, 57th)
After Penn State: 430.0 (8th, 61st)
After Missouri: 376.8 (12th, 89th)
After LSU: 389.0 (10th, 80th)
After Georgia: 367.2 (12th, 94th)
Why: Auburn had 258 yards of offense against Georgia.
.
SCORING OFFENSE
2013: 39.5 (2nd, 12th)
2014: 35.5 (4th, 35th)
2015: 27.5 (8th, 75th)
2016: 31.2 (6th, 49th)
2017: 33.9 (4th, 27th)
2018: 30.9 (8th, 47th)
2019: 33.2 (3rd, 28th)
2020: 25.1 (9th, 89th)
2021: 27.8 (11th, 71st)
After Mercer: 42.0 (7th, 34th)
After San Jose State: 33.0 (9th, 67th)
After Penn State: 26.0 (11th, 91st)
After Missouri: 23.8 (13th, 100th)
After LSU: 22.4 (13th, 107th)
After Georgia: 20.3 (14th, 112th)
Why: Auburn scored 10 points in Week 6.
.
SACKS ALLOWED
2013: 18 sacks, 1.29 per game (3rd, 22nd)
2014: 15 sacks, 1.15 per game (3rd, 15th)
2015: 19 sacks, 1.46 per game (4th, 33rd)
2016: 19 sacks, 1.46 per game (3rd, 27th)
2017: 36 sacks, 2.57 per game (10th, 100th)
2018: 23 sacks, 1.77 per game (6th, 39th)
2019: 18 sacks, 1.38 per game (4th, 18th)
2020: 20 sacks, 1.82 per game (6th, 41st)
2021: 22 sacks, 1.69 per game (5th, 31st)
After Mercer: 0 sacks, 0.00 per game (1st, 1st)
After San Jose State: 1 sack, 0.50 per game (2nd, 12th)
After Penn State: 8 sacks, 2.33 per game (10th, 84th)
After Missouri: 12 sacks, 3.00 per game (12th, 112th)
After LSU: 15 sacks, 3.00 per game (12th, 111th)
After Georgia: 15 sacks, 2.50 per game (11th, 95th)
Why: Auburn did not give up a sack against Georgia.
.
THIRD-DOWN CONVERSIONS
2013: 46.5 percent (4th, 24th)
2014: 52.5 percent (1st, 2nd)
2015: 41.3 percent (6th, 49th)
2016: 41.8 percent (4th, 53rd)
2017: 45.5 percent (3rd, 15th)
2018: 36.9 percent (11th, 90th)
2019: 40.5 percent (6th, 60th)
2020: 44.9 percent (6th, 32nd)
2021: 40.2 percent (8th, 61st)
After Mercer: 50.0 percent (7th, 40th)
After San Jose State: 42.1 percent (8th, 57th)
After Penn State: 38.2 percent (10th, 78th)
After Missouri: 32.0 percent (13th, 114th)
After LSU: 33.8 percent (12th, 105th)
After Georgia: 32.9 percent (14th, 114th)
Why: Auburn converted five of its 17 third-down attempts in Week 6.
.
RED ZONE OFFENSE
2013: 88.5 percent (2nd, 21st)
2014: 87.9 percent (4th, 31st)
2015: 90.2 percent (2nd, 13th)
2016: 85.5 percent (5th, 52nd)
2017: 88.1 percent (6th, 36th)
2018: 81.1 percent (11th, 88th)
2019: 90.4 percent (3rd, 21st)
2020: 85.0 percent (6th, 50th)
2021: 84.8 percent (7th, 55th)
After Mercer: 100.0 percent (1st, 1st)
After San Jose State: 100.0 percent (1st, 1st)
After Penn State: 83.3 percent (11th, 73rd)
After Missouri: 85.7 percent (8th, 62nd)
After LSU: 82.4 percent (10th, 75th)
After Georgia: 83.3 percent (7th, 64th)
Why: Auburn scored a field goal on its lone red-zone trip against Georgia.
RUSHING DEFENSE
2013: 162.1 (10th, 62nd)
2014: 168.8 (10th, 67th)
2015: 182.7 (11th, 81st)
2016: 132.8 (3rd, 27th)
2017: 137.0 (5th, 35th)
2018: 135.9 (6th, 32nd)
2019: 123.2 (4th, 25th)
2020: 163.4 (8th, 62nd)
2021: 128.1 (5th, 29th)
After Mercer: 74.0 (3rd, 25th)
After San Jose State: 64.0 (1st, 10th)
After Penn State: 124.3 (8th, 55th)
After Missouri: 126.5 (10th, 52nd)
After LSU: 138.2 (9th, 65th)
After Georgia: 163.8 (11th, 92nd)
Why: Georgia ran for 292 yards and six touchdowns against Georgia.
.
PASSING DEFENSE
2013: 258.6 (13th, 100th)
2014: 230.1 (12th, 68th)
2015: 222.5 (11th, 63rd)
2016: 229.2 (9th, 67th)
2017: 182.4 (5th, 18th)
2018: 219.5 (7th, 58th)
2019: 213.8 (8th, 47th)
2020: 242.6 (4th, 79th)
2021: 245.8 (12th, 96th)
After Mercer: 197.0 (7th, 56th)
After San Jose State: 236.0 (11th, 83rd)
After Penn State: 234.7 (11th, 81st)
After Missouri: 220.8 (10th, 65th)
After LSU: 193.6 (7th, 35th)
After Georgia: 196.0 (8th, 32nd)
Why: Georgia threw for 208 yards against Auburn.
.
PASS EFFICIENCY DEFENSE
2013: 126.88 (9th, 63rd)
2014: 124.19 (10th, 52nd)
2015: 116.99 (8th, 31st)
2016: 116.83 (4th, 22nd)
2017: 113.84 (4th, 19th)
2018: 118.12 (6th, 31st)
2019: 120.71 (9th, 32nd)
2020: 139.34 (7th, 75th)
2021: 136.73 (9th, 75th)
After Mercer: 122.63 (9th, 66th)
After San Jose State: 120.06 (10th, 63rd)
After Penn State: 129.03 (11th, 73rd)
After Missouri: 125.83 (10th, 58th)
After LSU: 115.38 (6th, 29th)
After Georgia: 116.79 (6th, 27th)
Why: Stetson Bennett completed 22-of-32 passes for 208 yards against Auburn.
.
TOTAL DEFENSE
2013: 420.7 (12th, 86th)
2014: 398.8 (9th, 64th)
2015: 405.2 (13th, 71st)
2016: 361.9 (5th, 28th)
2017: 319.4 (5th, 14th)
2018: 355.4 (8th, 38th)
2019: 337.0 (7th, 28th)
2020: 406.0 (6th, 63rd)
2021: 373.8 (9th, 61st)
After Mercer: 271.0 (3rd, 35th)
After San Jose State: 300.0 (6th, 40th)
After Penn State: 359.0 (10th, 56th)
After Missouri: 347.2 (9th, 49th)
After LSU: 331.8 (6th, 35th)
After Georgia: 359.8 (9th, 56th)
Why: Auburn gave up 500 yards of offense to Georgia.
.
SCORING DEFENSE
2013: 24.7 (9th, 48th)
2014: 26.7 (10th, 62nd)
2015: 26.0 (11th, 54th)
2016: 17.1 (4th, 7th)
2017: 18.5 (3rd, 12th)
2018: 19.2 (4th, 14th)
2019: 19.5 (6th, 17th)
2020: 24.7 (4th, 38th)
2021: 21.8 (5th, 27th)
After Mercer: 16.0 (8th, 48th)
After San Jose State: 16.0 (6th, 42nd)
After Penn State: 24.3 (9th, 66th)
After Missouri: 21.8 (9th, 58th)
After LSU: 21.6 (8th, 44th)
After Georgia: 25.0 (10th, 60th)
Why: Auburn allowed 42 points against Georgia.
.
SACKS
2013: 32 sacks, 2.29 per game (4th, 46th)
2014: 21 sacks, 1.62 per game (11th, 95th)
2015: 19 sacks, 1.46 per game (13th, 104th)
2016: 25 sacks, 1.92 per game (8th, 75th)
2017: 37 sacks, 2.64 per game (5th, 25th)
2018: 38, 2.92 per game (3rd, 16th)
2019: 28 sacks, 2.15 per game (9th, 64th)
2020: 26 sacks, 2.36 per game (6th, 53rd)
2021: 35, 2.69 per game (7th, 40th)
After Mercer: 1 sack, 1.00 per game (7th, 71st)
After San Jose State: 4 sacks, 2.00 per game (3rd, 61st)
After Penn State: 4 sacks, 1.33 per game (9th, 98th)
After Missouri: 8 sacks, 2.00 per game (6th, 71st)
After LSU: 11 sacks, 2.20 per game (7th, 57th)
After Georgia: 12 sacks, 2.00 per game (7th, 69th)
Why: Auburn had one sack against Georgia.
.
THIRD-DOWN DEFENSE
2013: 33.0 percent (1st, 13th)
2014: 36.0 percent (4th, 29th)
2015: 44.9 percent (13th, 109th)
2016: 34.8 percent (4th, 25th)
2017: 32.9 percent (3rd, 20th)
2018: 34.7 percent (6th, 30th)
2019: 29.9 percent (2nd, 8th)
2020: 50.3 percent (14th, 121st)
2021: 35.8 percent (7th, 37th)
After Mercer: 44.4 percent (10th, 92nd)
After San Jose State: 38.7 percent (10th, 87th)
After Penn State: 40.5 percent (11th, 91st)
After Missouri: 38.2 percent (11th, 73rd)
After LSU: 37.1 percent (10th, 65th)
After Georgia: 38.1 percent (10th, 68th)
Why: Georgia converted 6-of-14 third-down tries against Auburn.
.
RED ZONE DEFENSE
2013: 73.1 percent (2nd, 10th)
2014: 74.1 percent (4th, 13th)
2015: 75.5 percent (5th, 15th)
2016: 74.4 percent (3rd, 11th)
2017: 83.3 percent (6th, 64th)
2018: 82.9 percent (9th, 64th)
2019: 71.8 percent (2nd, 8th)
2020: 76.3 percent (3rd, 27th)
2021: 81.6 percent (6th, 58th)
After Mercer: 100.0 percent (8th, 78th)
After San Jose State: 87.5 percent (12th, 83rd)
After Penn State: 92.3 percent (14th, 108th)
After Missouri: 82.4 percent (7th, 60th)
After LSU: 84.2 percent (11th, 77th)
After Georgia: 87.5 percent (12th, 96th)
Why: Georgia scored touchdowns on all five of its red-zone opportunities against Auburn.
NET PUNTING
2013: 40.54 (2nd, 9th)
2014: 37.44 (12th, 67th)
2015: 37.58 (7th, 54th)
2016: 39.90 (5th, 21st)
2017: 35.61 (14th, 115th)
2018: 41.91 (2nd, 5th)
2019: 38.50 (9th, 63rd)
2020: 38.70 (9th, 64th)
2021: 41.79 (3rd, 20th)
After Mercer: 29.00 (11th, 111th)
After San Jose State: 39.75 (8th, 66th)
After Penn State: 40.71 (6th, 52nd)
After Missouri: 43.53 (2nd, 10th)
After LSU: 44.11 (1st, 6th)
After Georgia: 41.68 (2nd, 16th)
Why: Auburn’s Oscar Chapman averaged just 36.6 net yards per punt against Georgia.
.
KICK RETURNS
2013: 23.40 (5th, 27th)
2014: 20.03 (11th, 82nd)
2015: 27.94 (2nd, 4th)
2016: 19.04 (12th, 100th)
2017: 23.22 (3rd, 25th)
2018: 21.52 (6th, 48th)
2019: 20.50 (7th, 67th)
2020: 21.96 (6th, 43rd)
2021: 23.88 (6th, 25th)
After Mercer: 7.67 (12th, 108th)
After San Jose State: 5.20 (14th, 127th)
After Penn State: 11.56 (14th, 124th)
After Missouri: 11.56 (14th, 127th)
After LSU: 13.75 (14th, 121st)
After Georgia: 14.08 (14th, 124th)
Why: Auburn had one 18-yard kickoff return against Georgia.
.
KICK RETURN DEFENSE
2013: 25.79 (14th, 121st)
2014: 21.73 (9th, 84th)
2015: 21.17 (12th, 61st)
2016: 18.00 (1st, 13th)
2017: 27.20 (14th, 129th)
2018: 19.44 (3rd, 39th)
2019: 22.30 (11th, 96th)
2020: 26.67 (13th, 121st)
2021: 17.36 (3rd, 15th)
After Mercer: 13.00 (8th, 35th)
After San Jose State: 13.67 (4th, 20th)
After Penn State: 17.75 (5th, 35th)
After Missouri: 17.40 (5th, 25th)
After LSU: 18.75 (7th, 44th)
After Georgia: 18.25 (6th, 39th)
Why: Georgia had one 16-yard kickoff return against Auburn.
.
PUNT RETURNS
2013: 11.78 (2nd, 22nd)
2014: 17.82 yards per return (1st, 4th)
2015: 11.93 yards per return (7th, 28th)
2016: 10.69 (5th, 24th)
2017: 8.52 (8th, 51st)
2018: 10.75 (6th, 39th)
2019: 12.83 (4th, 18th)
2020: 9.11 (6th, 44th)
2021: 8.30 (7th, 60th)
After Mercer: 9.00 (3rd, 35th)
After San Jose State: 11.17 (4th, 33rd)
After Penn State: 10.88 (7th, 42nd)
After Missouri: 9.60 (7th, 44th)
After LSU: 8.92 (7th, 50th)
After Georgia: 8.92 (9th, 52nd)
Why: Auburn did not return a punt against Georgia.
.
PUNT RETURN DEFENSE
2013: 7.0 (8th, 51st)
2014: 7.79 (10th, 72nd)
2015: 12.43 (11th, 110th)
2016: 3.17 (1st, 8th)
2017: 11.43 (14th, 108th)
2018: 3.36 (3rd, 9th)
2019: 17.29 (14th, 130th)
2020: 2.75 (3rd, 17th)
2021: 4.12 (2nd, 23rd)
After Mercer: 0.00 (1st, 12th)
After San Jose State: 0.00 (1st, 13th)
After Penn State: 0.00 (1st, 14th)
After Missouri: minus-0.50 (1st, 5th)
After LSU: minus-0.50 (1st, 5th)
After Georgia: 7.43 (8th, 67th)
Why: Georgia averaged 10.6 yards on five punt returns against Auburn.
.
TURNOVER MARGIN
2013: even, 0.0 per game (9th, 61st)
2014: plus-seven, 0.54 per game (4th, 27th)
2015: plus-two, 0.15 per game (8th, 51st)
2016: plus-three, 0.23 per game (6th, 42nd)
2017: minus-one, minus-0.07 per game (7th, 71st)
2018: plus-nine, 0.69 (3rd, 16th)
2019: plus-six, 0.46 per game (3rd, 27th)
2020: plus-four, 0.36 per game (6th, 38th)
2021: plus-one, 0.08 per game (8th, 64th)
After Mercer: minus-two, minus-2.00 per game (13th, 106th)
After San Jose State: minus-four, minus-2.00 per game (14th, 121st)
After Penn State: minus-eight, minus-2.67 per game (14th, 130th)
After Missouri: minus-six, minus-1.50 per game (13th, 126th)
After LSU: minus-nine, minus-1.80 per game (14th, 129th)
After Georgia: minus-nine, minus-1.50 per game (14th, 128th)
Why: Auburn forced one turnover and committed one against Georgia.
.
PENALTY YARDS PER GAME
2013: 40.64 (7th 30th)
2014: 68.92 (14th, 112th)
2015: 46.38 (7th, 34th)
2016: 36.54 (1st, 6th)
2017: 38.36 (2nd, 13th)
2018: 56.69 (9th, 75th)
2019: 55.23 (10th, 74th)
2020: 49.82 (7th, 56th)
2021: 46.38 (6th, 44th)
After Mercer: 20.00 (2nd, 5th)
After San Jose State: 52.50 (7th, 53rd)
After Penn State: 55.33 (7th, 60th)
After Missouri: 48.00 (6th, 40th)
After LSU: 54.40 (7th, 55th)
After Georgia: 55.33 (8th, 58th)
Why: Auburn committed a season-high 10 penalties for 60 yards against Georgia.
Tom Green is an Auburn beat reporter for Alabama Media Group. Follow him on Twitter @Tomas_Verde.