Statistically speaking: Auburn has nation’s worst turnover margin
Bryan Harsin was succinct in discussing Auburn’s turnover issues after his team’s loss to Ole Miss on Saturday.
“Turnovers are still a factor,” Harsin said.
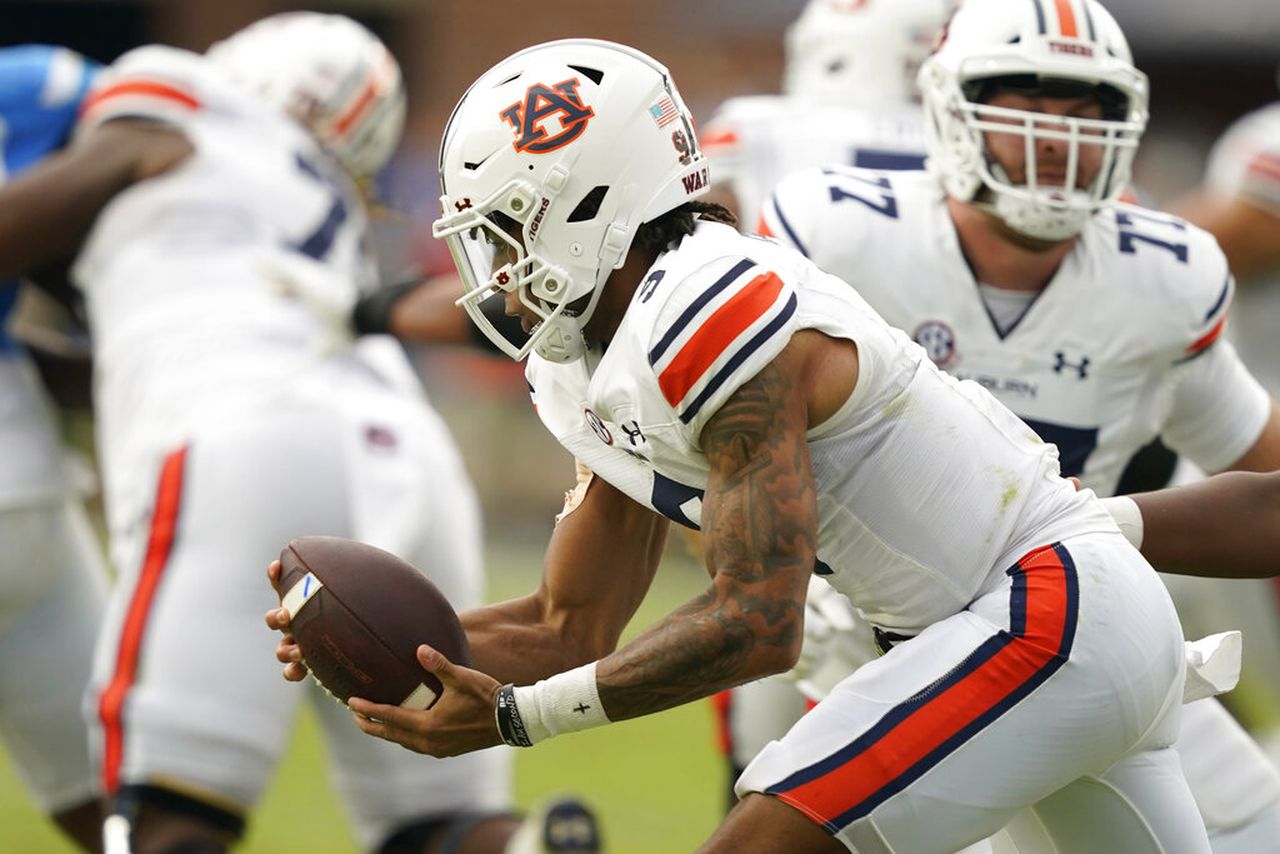
They continue to be an issue that has plagued Auburn as it hits the bye week, with the team’s latest stumble — a 48-34 loss in Oxford, Miss. — including three more giveaways by the Tigers’ offense. Robby Ashford threw a pair of interceptions, while T.J. Finley lost a fumble on a strip-sack against the Rebels in Week 7. Ole Miss scored 14 points off those three Auburn turnovers, turning two of them into first-half touchdowns. The third came on Auburn’s final offensive snap, and Ole Miss was able to run out the clock from there to send the Tigers home with their third loss in a row.
Read more Auburn football: Ole Miss brings out best in Tank Bigsby as he passes Michael Dyer on Auburn career rushing list
That one sucked”: Ole Miss’ surprise onside kick looms large for Auburn in loss
Auburn’s run defense decimated by Ole Miss in worst performance in 20 years
It’s the fifth time in seven games this season that Auburn has committed multiple turnovers and the third game in which the Tigers have turned the ball over at least three times. In all, Auburn has committed 16 turnovers this season and, combined with the defense’s five takeaways, Harsin’s team now boasts a minus-11 turnover margin that is the nation’s worst through Week 7. The Tigers’ 16 total turnovers are tied with Northwestern for second most among FBS teams, ahead of only Utah State’s 18. Temple is the only FBS team with a worst per-game turnover margin than Auburn this year; the Owls have a minus-1.67 turnover margin through six games (13 turnovers against three takeaways; minus-10 overall turnover margin) compared to the Tigers’ minus-1.57 through seven games.
Auburn last finished a season with a negative turnover margin in 2017, when it was minus-one on the year. Barring a significant turnaround over the final five regular-season games, Auburn will finish with its worst turnover margin in a decade; the 2012 team was minus-12 on the season while finishing with a 3-9 record.
Here’s a look at those numbers, as well as where Auburn ranks in various statistical categories — both in the SEC and among all FBS teams — as the Tigers hit the bye week:
—
RUSHING OFFENSE (SEC rank, FBS rank)
2013: 328.3 (1st, 1st)
2014: 255.5 (2nd, 13th)
2015: 196.4 (5th, 35th)
2016: 271.3 (1st, 6th)
2017: 218.3 (4th, 26th)
2018: 167.5 (10th, 68th)
2019: 199.1 (4th, 33rd)
2020: 162.5 (7th, 67th)
2021: 161.5 (9th, 66th)
After Mercer: 285.0 (3rd, 14th)
After San Jose State: 247.5 (3rd, 14th)
After Penn State: 204.7 (6th 40th)
After Missouri: 174.0 (10th, 57th)
After LSU: 159.4 (10th, 66th)
After Georgia: 148.3 (10th, 75th)
After Ole Miss: 170.1 (8th, 53rd)
Why: Auburn ran for a season-high 301 yards against Ole Miss.
.
PASSING OFFENSE
2013: 173.0 (11th, 106th)
2014: 229.5 (7th, 66th)
2015: 173.6 (12th, 110th)
2016: 169.5 (14th, 112th)
2017: 233.4 (5th, 65th)
2018: 222.5 (9th, 74th)
2019: 207.5 (9th, 87th)
2020: 220.3 (10th, 71st)
2021: 240.0 (8th, 59th)
After Mercer: 212.0 (11th, 84th)
After San Jose State: 190.0 (12th, 103rd)
After Penn State: 225.3 (9th, 87th)
After Missouri: 202.8 (12th, 103rd)
After LSU: 229.6 (9th, 82nd)
After Georgia: 218.8 (11th, 97th)
After Ole Miss: 207.6 (13th, 104th)
Why: Auburn threw for 140 yards against Ole Miss.
.
PASS EFFICIENCY OFFENSE
2013: 149.63 (6th, 24th)
2014: 156.79 (1st, 8th)
2015: 124.47 (10th, 79th)
2016: 135.17 (6th, 54th)
2017: 153.59 (5th, 13th)
2018: 140.11 (8th, 51st)
2019: 128.35 (9th, 89th)
2020: 122.96 (11th, 89th)
2021: 126.85 (12th, 94th)
After Mercer: 143.37 (9th, 61st)
After San Jose State: 123.23 (12th, 94th)
After Penn State: 121.20 (12th, 104th)
After Missouri: 121.09 (13th, 105th)
After LSU: 122.98 (13th, 101st)
After Georgia: 113.77 (14th, 114th)
After Ole Miss: 111.96 (14th, 115th)
Why: Robby Ashford completed 8-of-17 passes for 140 yards and two interceptions against Ole Miss.
.
TOTAL OFFENSE
2013: 501.3 (2nd, 11th)
2014: 485.0 (2nd, 16th)
2015: 370.0 (10th, 94th)
2016: 440.8 (6th, 43rd)
2017: 451.6 (3rd, 26th)
2018: 389.9 (11th, 78th)
2019: 406.5 (6th, 64th)
2020: 382.8 (9th, 77th)
2021: 401.5 (10th, 67th)
After Mercer: 497.0 (7th, 49th)
After San Jose State: 437.5 (9th, 57th)
After Penn State: 430.0 (8th, 61st)
After Missouri: 376.8 (12th, 89th)
After LSU: 389.0 (10th, 80th)
After Georgia: 367.2 (12th, 94th)
After Ole Miss: 377.7 (10th, 81st)
Why: Auburn had 441 yards of offense against Ole Miss.
.
SCORING OFFENSE
2013: 39.5 (2nd, 12th)
2014: 35.5 (4th, 35th)
2015: 27.5 (8th, 75th)
2016: 31.2 (6th, 49th)
2017: 33.9 (4th, 27th)
2018: 30.9 (8th, 47th)
2019: 33.2 (3rd, 28th)
2020: 25.1 (9th, 89th)
2021: 27.8 (11th, 71st)
After Mercer: 42.0 (7th, 34th)
After San Jose State: 33.0 (9th, 67th)
After Penn State: 26.0 (11th, 91st)
After Missouri: 23.8 (13th, 100th)
After LSU: 22.4 (13th, 107th)
After Georgia: 20.3 (14th, 112th)
After Ole Miss: 22.3 (13th, 106th)
Why: Auburn scored 34 points in Week 7.
.
SACKS ALLOWED
2013: 18 sacks, 1.29 per game (3rd, 22nd)
2014: 15 sacks, 1.15 per game (3rd, 15th)
2015: 19 sacks, 1.46 per game (4th, 33rd)
2016: 19 sacks, 1.46 per game (3rd, 27th)
2017: 36 sacks, 2.57 per game (10th, 100th)
2018: 23 sacks, 1.77 per game (6th, 39th)
2019: 18 sacks, 1.38 per game (4th, 18th)
2020: 20 sacks, 1.82 per game (6th, 41st)
2021: 22 sacks, 1.69 per game (5th, 31st)
After Mercer: 0 sacks, 0.00 per game (1st, 1st)
After San Jose State: 1 sack, 0.50 per game (2nd, 12th)
After Penn State: 8 sacks, 2.33 per game (10th, 84th)
After Missouri: 12 sacks, 3.00 per game (12th, 112th)
After LSU: 15 sacks, 3.00 per game (12th, 111th)
After Georgia: 15 sacks, 2.50 per game (11th, 95th)
After Ole Miss: 18 sacks, 2.57 per game (12th, 102nd)
Why: Auburn gave up three sacks against Ole Miss.
.
THIRD-DOWN CONVERSIONS
2013: 46.5 percent (4th, 24th)
2014: 52.5 percent (1st, 2nd)
2015: 41.3 percent (6th, 49th)
2016: 41.8 percent (4th, 53rd)
2017: 45.5 percent (3rd, 15th)
2018: 36.9 percent (11th, 90th)
2019: 40.5 percent (6th, 60th)
2020: 44.9 percent (6th, 32nd)
2021: 40.2 percent (8th, 61st)
After Mercer: 50.0 percent (7th, 40th)
After San Jose State: 42.1 percent (8th, 57th)
After Penn State: 38.2 percent (10th, 78th)
After Missouri: 32.0 percent (13th, 114th)
After LSU: 33.8 percent (12th, 105th)
After Georgia: 32.9 percent (14th, 114th)
After Ole Miss: 33.3 percent (14th, 108th)
Why: Auburn converted five of its 14 third-down attempts in Week 7.
.
RED ZONE OFFENSE
2013: 88.5 percent (2nd, 21st)
2014: 87.9 percent (4th, 31st)
2015: 90.2 percent (2nd, 13th)
2016: 85.5 percent (5th, 52nd)
2017: 88.1 percent (6th, 36th)
2018: 81.1 percent (11th, 88th)
2019: 90.4 percent (3rd, 21st)
2020: 85.0 percent (6th, 50th)
2021: 84.8 percent (7th, 55th)
After Mercer: 100.0 percent (1st, 1st)
After San Jose State: 100.0 percent (1st, 1st)
After Penn State: 83.3 percent (11th, 73rd)
After Missouri: 85.7 percent (8th, 62nd)
After LSU: 82.4 percent (10th, 75th)
After Georgia: 83.3 percent (7th, 64th)
After Ole Miss: 86.4 percent (7th, 46th)
Why: Auburn scored on all four of its red-zone trips against Ole Miss, with three touchdowns and a field goal.
RUSHING DEFENSE
2013: 162.1 (10th, 62nd)
2014: 168.8 (10th, 67th)
2015: 182.7 (11th, 81st)
2016: 132.8 (3rd, 27th)
2017: 137.0 (5th, 35th)
2018: 135.9 (6th, 32nd)
2019: 123.2 (4th, 25th)
2020: 163.4 (8th, 62nd)
2021: 128.1 (5th, 29th)
After Mercer: 74.0 (3rd, 25th)
After San Jose State: 64.0 (1st, 10th)
After Penn State: 124.3 (8th, 55th)
After Missouri: 126.5 (10th, 52nd)
After LSU: 138.2 (9th, 65th)
After Georgia: 163.8 (11th, 92nd)
After Ole Miss: 204.4 (14th, 120th)
Why: Ole Miss ran for 448 yards against Auburn.
.
PASSING DEFENSE
2013: 258.6 (13th, 100th)
2014: 230.1 (12th, 68th)
2015: 222.5 (11th, 63rd)
2016: 229.2 (9th, 67th)
2017: 182.4 (5th, 18th)
2018: 219.5 (7th, 58th)
2019: 213.8 (8th, 47th)
2020: 242.6 (4th, 79th)
2021: 245.8 (12th, 96th)
After Mercer: 197.0 (7th, 56th)
After San Jose State: 236.0 (11th, 83rd)
After Penn State: 234.7 (11th, 81st)
After Missouri: 220.8 (10th, 65th)
After LSU: 193.6 (7th, 35th)
After Georgia: 196.0 (8th, 32nd)
After Ole Miss: 186.6 (5th, 20th)
Why: Ole Miss threw for 130 yards against Auburn.
.
PASS EFFICIENCY DEFENSE
2013: 126.88 (9th, 63rd)
2014: 124.19 (10th, 52nd)
2015: 116.99 (8th, 31st)
2016: 116.83 (4th, 22nd)
2017: 113.84 (4th, 19th)
2018: 118.12 (6th, 31st)
2019: 120.71 (9th, 32nd)
2020: 139.34 (7th, 75th)
2021: 136.73 (9th, 75th)
After Mercer: 122.63 (9th, 66th)
After San Jose State: 120.06 (10th, 63rd)
After Penn State: 129.03 (11th, 73rd)
After Missouri: 125.83 (10th, 58th)
After LSU: 115.38 (6th, 29th)
After Georgia: 116.79 (6th, 27th)
After Ole Miss: 119.60 (7th, 30th)
Why: Jaxson Dart completed 9-of-19 passes for 130 yards, three touchdowns and an interception against Auburn.
.
TOTAL DEFENSE
2013: 420.7 (12th, 86th)
2014: 398.8 (9th, 64th)
2015: 405.2 (13th, 71st)
2016: 361.9 (5th, 28th)
2017: 319.4 (5th, 14th)
2018: 355.4 (8th, 38th)
2019: 337.0 (7th, 28th)
2020: 406.0 (6th, 63rd)
2021: 373.8 (9th, 61st)
After Mercer: 271.0 (3rd, 35th)
After San Jose State: 300.0 (6th, 40th)
After Penn State: 359.0 (10th, 56th)
After Missouri: 347.2 (9th, 49th)
After LSU: 331.8 (6th, 35th)
After Georgia: 359.8 (9th, 56th)
After Ole Miss: 391.0 (10th, 81st)
Why: Auburn gave up 578 yards of offense to Ole Miss.
.
SCORING DEFENSE
2013: 24.7 (9th, 48th)
2014: 26.7 (10th, 62nd)
2015: 26.0 (11th, 54th)
2016: 17.1 (4th, 7th)
2017: 18.5 (3rd, 12th)
2018: 19.2 (4th, 14th)
2019: 19.5 (6th, 17th)
2020: 24.7 (4th, 38th)
2021: 21.8 (5th, 27th)
After Mercer: 16.0 (8th, 48th)
After San Jose State: 16.0 (6th, 42nd)
After Penn State: 24.3 (9th, 66th)
After Missouri: 21.8 (9th, 58th)
After LSU: 21.6 (8th, 44th)
After Georgia: 25.0 (10th, 60th)
After Ole Miss: 28.3 (12th, 78th)
Why: Auburn allowed 48 points against Ole Miss.
.
SACKS
2013: 32 sacks, 2.29 per game (4th, 46th)
2014: 21 sacks, 1.62 per game (11th, 95th)
2015: 19 sacks, 1.46 per game (13th, 104th)
2016: 25 sacks, 1.92 per game (8th, 75th)
2017: 37 sacks, 2.64 per game (5th, 25th)
2018: 38, 2.92 per game (3rd, 16th)
2019: 28 sacks, 2.15 per game (9th, 64th)
2020: 26 sacks, 2.36 per game (6th, 53rd)
2021: 35, 2.69 per game (7th, 40th)
After Mercer: 1 sack, 1.00 per game (7th, 71st)
After San Jose State: 4 sacks, 2.00 per game (3rd, 61st)
After Penn State: 4 sacks, 1.33 per game (9th, 98th)
After Missouri: 8 sacks, 2.00 per game (6th, 71st)
After LSU: 11 sacks, 2.20 per game (7th, 57th)
After Georgia: 12 sacks, 2.00 per game (7th, 69th)
After Ole Miss: 13 sacks, 1.86 per game (8th, 80th)
Why: Auburn had one sack against Ole Miss.
.
THIRD-DOWN DEFENSE
2013: 33.0 percent (1st, 13th)
2014: 36.0 percent (4th, 29th)
2015: 44.9 percent (13th, 109th)
2016: 34.8 percent (4th, 25th)
2017: 32.9 percent (3rd, 20th)
2018: 34.7 percent (6th, 30th)
2019: 29.9 percent (2nd, 8th)
2020: 50.3 percent (14th, 121st)
2021: 35.8 percent (7th, 37th)
After Mercer: 44.4 percent (10th, 92nd)
After San Jose State: 38.7 percent (10th, 87th)
After Penn State: 40.5 percent (11th, 91st)
After Missouri: 38.2 percent (11th, 73rd)
After LSU: 37.1 percent (10th, 65th)
After Georgia: 38.1 percent (10th, 68th)
After Ole Miss: 42.7 percent (11th, 100th)
Why: Ole Miss converted 12-of-19 third-down tries against Auburn.
.
RED ZONE DEFENSE
2013: 73.1 percent (2nd, 10th)
2014: 74.1 percent (4th, 13th)
2015: 75.5 percent (5th, 15th)
2016: 74.4 percent (3rd, 11th)
2017: 83.3 percent (6th, 64th)
2018: 82.9 percent (9th, 64th)
2019: 71.8 percent (2nd, 8th)
2020: 76.3 percent (3rd, 27th)
2021: 81.6 percent (6th, 58th)
After Mercer: 100.0 percent (8th, 78th)
After San Jose State: 87.5 percent (12th, 83rd)
After Penn State: 92.3 percent (14th, 108th)
After Missouri: 82.4 percent (7th, 60th)
After LSU: 84.2 percent (11th, 77th)
After Georgia: 87.5 percent (12th, 96th)
After Ole Miss: 89.3 percent (13th, 112th)
Why: Ole Miss scored on all four of its red-zone opportunities against Auburn, with three touchdowns and a field goal.
NET PUNTING
2013: 40.54 (2nd, 9th)
2014: 37.44 (12th, 67th)
2015: 37.58 (7th, 54th)
2016: 39.90 (5th, 21st)
2017: 35.61 (14th, 115th)
2018: 41.91 (2nd, 5th)
2019: 38.50 (9th, 63rd)
2020: 38.70 (9th, 64th)
2021: 41.79 (3rd, 20th)
After Mercer: 29.00 (11th, 111th)
After San Jose State: 39.75 (8th, 66th)
After Penn State: 40.71 (6th, 52nd)
After Missouri: 43.53 (2nd, 10th)
After LSU: 44.11 (1st, 6th)
After Georgia: 41.68 (2nd, 16th)
After Ole Miss: 42.29 (3rd, 13th)
Why: Auburn’s Oscar Chapman averaged 50.7 net yards per punt against Ole Miss.
.
KICK RETURNS
2013: 23.40 (5th, 27th)
2014: 20.03 (11th, 82nd)
2015: 27.94 (2nd, 4th)
2016: 19.04 (12th, 100th)
2017: 23.22 (3rd, 25th)
2018: 21.52 (6th, 48th)
2019: 20.50 (7th, 67th)
2020: 21.96 (6th, 43rd)
2021: 23.88 (6th, 25th)
After Mercer: 7.67 (12th, 108th)
After San Jose State: 5.20 (14th, 127th)
After Penn State: 11.56 (14th, 124th)
After Missouri: 11.56 (14th, 127th)
After LSU: 13.75 (14th, 121st)
After Georgia: 14.08 (14th, 124th)
After Ole Miss: 14.50 (14th, 124th)
Why: Auburn had one 20-yard kickoff return against Ole Miss.
.
KICK RETURN DEFENSE
2013: 25.79 (14th, 121st)
2014: 21.73 (9th, 84th)
2015: 21.17 (12th, 61st)
2016: 18.00 (1st, 13th)
2017: 27.20 (14th, 129th)
2018: 19.44 (3rd, 39th)
2019: 22.30 (11th, 96th)
2020: 26.67 (13th, 121st)
2021: 17.36 (3rd, 15th)
After Mercer: 13.00 (8th, 35th)
After San Jose State: 13.67 (4th, 20th)
After Penn State: 17.75 (5th, 35th)
After Missouri: 17.40 (5th, 25th)
After LSU: 18.75 (7th, 44th)
After Georgia: 18.25 (6th, 39th)
After Ole Miss: 20.45 (9th, 71st)
Why: Ole Miss averaged 26.3 yards on three kickoff returns against Auburn.
.
PUNT RETURNS
2013: 11.78 (2nd, 22nd)
2014: 17.82 yards per return (1st, 4th)
2015: 11.93 yards per return (7th, 28th)
2016: 10.69 (5th, 24th)
2017: 8.52 (8th, 51st)
2018: 10.75 (6th, 39th)
2019: 12.83 (4th, 18th)
2020: 9.11 (6th, 44th)
2021: 8.30 (7th, 60th)
After Mercer: 9.00 (3rd, 35th)
After San Jose State: 11.17 (4th, 33rd)
After Penn State: 10.88 (7th, 42nd)
After Missouri: 9.60 (7th, 44th)
After LSU: 8.92 (7th, 50th)
After Georgia: 8.92 (9th, 52nd)
After Ole Miss: 8.92 (8th, 51st)
Why: Auburn did not return a punt against Ole Miss.
.
PUNT RETURN DEFENSE
2013: 7.0 (8th, 51st)
2014: 7.79 (10th, 72nd)
2015: 12.43 (11th, 110th)
2016: 3.17 (1st, 8th)
2017: 11.43 (14th, 108th)
2018: 3.36 (3rd, 9th)
2019: 17.29 (14th, 130th)
2020: 2.75 (3rd, 17th)
2021: 4.12 (2nd, 23rd)
After Mercer: 0.00 (1st, 12th)
After San Jose State: 0.00 (1st, 13th)
After Penn State: 0.00 (1st, 14th)
After Missouri: minus-0.50 (1st, 5th)
After LSU: minus-0.50 (1st, 5th)
After Georgia: 7.43 (8th, 67th)
After Ole Miss: 7.00 (7th, 60th)
Why: Ole Miss had one punt return for a loss of 4 yards against Auburn.
.
TURNOVER MARGIN
2013: even, 0.0 per game (9th, 61st)
2014: plus-seven, 0.54 per game (4th, 27th)
2015: plus-two, 0.15 per game (8th, 51st)
2016: plus-three, 0.23 per game (6th, 42nd)
2017: minus-one, minus-0.07 per game (7th, 71st)
2018: plus-nine, 0.69 (3rd, 16th)
2019: plus-six, 0.46 per game (3rd, 27th)
2020: plus-four, 0.36 per game (6th, 38th)
2021: plus-one, 0.08 per game (8th, 64th)
After Mercer: minus-two, minus-2.00 per game (13th, 106th)
After San Jose State: minus-four, minus-2.00 per game (14th, 121st)
After Penn State: minus-eight, minus-2.67 per game (14th, 130th)
After Missouri: minus-six, minus-1.50 per game (13th, 126th)
After LSU: minus-nine, minus-1.80 per game (14th, 129th)
After Georgia: minus-nine, minus-1.50 per game (14th, 128th)
After Ole Miss: minus-11, minus-1.57 per game (14th, 130th)
Why: Auburn forced one turnover and committed three against Ole Miss.
.
PENALTY YARDS PER GAME
2013: 40.64 (7th 30th)
2014: 68.92 (14th, 112th)
2015: 46.38 (7th, 34th)
2016: 36.54 (1st, 6th)
2017: 38.36 (2nd, 13th)
2018: 56.69 (9th, 75th)
2019: 55.23 (10th, 74th)
2020: 49.82 (7th, 56th)
2021: 46.38 (6th, 44th)
After Mercer: 20.00 (2nd, 5th)
After San Jose State: 52.50 (7th, 53rd)
After Penn State: 55.33 (7th, 60th)
After Missouri: 48.00 (6th, 40th)
After LSU: 54.40 (7th, 55th)
After Georgia: 55.33 (8th, 58th)
After Ole Miss: 54.14 (8th, 58th)
Why: Auburn committed five penalties for 46 yards against Ole Miss.
Tom Green is an Auburn beat reporter for Alabama Media Group. Follow him on Twitter @Tomas_Verde.