How Alabama compares to Tennessee
The Alabama-Tennessee hype train is coming down the tracks don’t expect it to slow down.
With ESPN’s College GameDay coming in the morning and a 2:30 p.m. CT CBS broadcast timeslot, this will be the game everyone’s watching this week. These two are in the top six of the AP poll as the Vols carry a 6-0 record into what’ll be the hottest Neyland Stadium ticket in decades.
Before we get too deep into this, let’s look at the basics. Midway through the regular season, a few statistical patterns are emerging — a few coming with caveats.
Of note, Alabama has the No. 3 rushing offense in the nation with service academy numbers. Only Air Force and Army average more ground yards a game but Tennessee has handled the run well to this point. The Vols enter with the No. 11 rush defense with an average allowance of 89.2 yards a game.
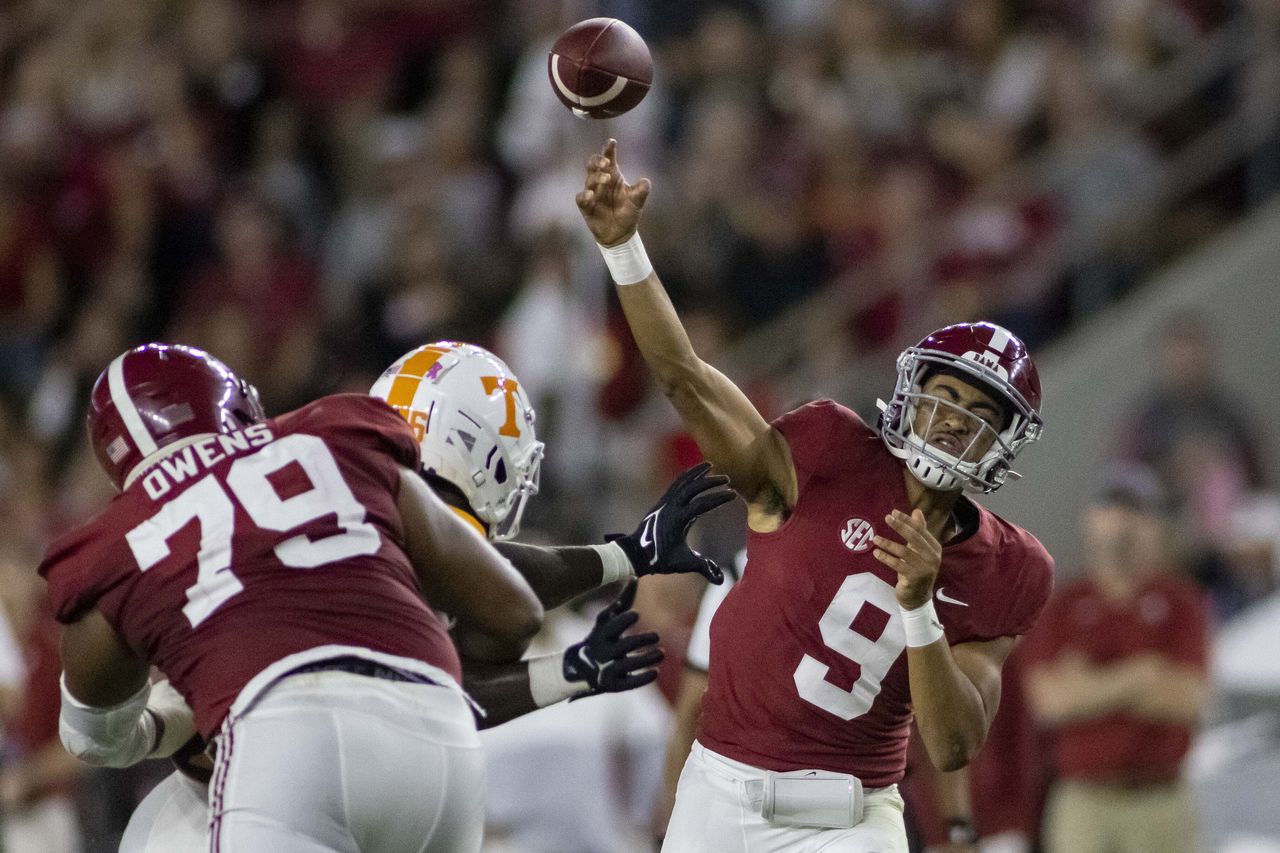
Alabama’s passing game is down to No. 68 (246.5 yards per game) after tallying just 111 in Saturday’s win over Texas A&M. Of course that came with Jalen Milroe at quarterback instead of Bryce Young and there’s increasing optimism the Heisman Trophy winner will play against Tennessee.
If the Vols have been susceptible, it’s in the passing game. They’re No. 128 of 131 FBS teams allowing 307.4 passing yards a game. Florida threw for 453 yards in the Vols 38-33 win on Sept. 24 in Knoxville.
The stunning number for Alabama comes in the turnover margin category. The Tide is No. 118 with a negative-6 margin after losing four and gaining one against Texas A&M. Alabama hasn’t finished a season with more giveaways than takeaways since 2014 with a negative-2 margin.
Here’s the full rundown to get you in the mindset for what will be a huge week in the SEC.
Rushing offense
1. Air Force 352.2
3. Alabama 257.5
23. Tennessee 207.4
Passing offense
1. Texas Tech 365.2
7. Tennessee
68. Alabama 246.5
Total offense
1. Tennessee 547.8
2. Ohio State 543.7
7. Alabama 504.0
Scoring offense
1. Ohio State 48.8
2. Tennessee 46.8
5. Alabama 44.3
Rushing defense
1. James Madison 42.0
8 Alabama 84.5
11. Tennessee 89.2
Passing defense
1. Boise State 134.3
12. Alabama 166.3
128. Tennessee 307.4
Total defense
1. Minnesota 222.0
6. Alabama 250.8
87. Tennessee 396.6
Scoring defense
1. Illinois 8.0
6. Alabama 12.5
22. Tennessee 17.8
Turnover margin
1. USC +14
18. Tennessee +5
118. Alabama -6
Interceptions
1. USC 12
52. Tennessee 5
108. Alabama 2
Fumbles recovered
1. Coastal Carolina 9
24. Tennessee 5
115. Alabama 1
Penalties
1. Kentucky 27.0 yards per game
117. Alabama 71.5
125. Tennessee 78.6
3rd down offense
1. Minnesota 70.3%
28. Alabama 46.5%
40. Tennessee 44.8%
3rd down defense
1. Minnesota 17.9%
2. Alabama 22.6%
33. Tennessee 32.0%
Red zone scoring
1. Tennessee 100% (28/28)
52. Alabama 85.7% (24/28)
Red zone touchdowns
1. Ohio State 93.1% (27/29)
12. Tennessee 78.6% (22/28)
19. Alabama 75.0% (21/28)
Opponents red zone scoring
1. UCF 47.4% (9/19)
7. Tennessee 65.0% (13/20)
38. Alabama 77.8% (14/18)
Sacks
1. USC 24.0
15. Alabama 18.0
39. Tennessee 14.0
Sacks allowed
1. Oregon 1.0
34. Tennessee 8.0
44. Alabama 9.0
Tackles for loss
1. Cincinnati 58.0
14. Alabama 44.0
50. Tennessee 35.0
Tackles for loss allowed
1. Tennessee 17.0
2. Georgia Southern 18.0
62. Alabama 30.0
20-yard plays
1. Florida State 45
4. Alabama 41
35. Tennessee 33
20-yard plays allowed
1. Minnesota 8
9. Alabama 15
36. Tennessee 22